

Safety glasses. Forklifts. Yellow lines.
These were common sights I experienced from working for a manufacturer for almost a decade. I often found myself walking through the shop floor to get to meetings. My specific role was in supporting CAD/BIM software platforms for AEC professionals using software such as Autodesk® Revit® and Fabrication CADmep™. I managed manufacturer specific BIM content assets. That said, it was great to have the constant reminder about the realities of the real-life manufactured product in the back of my mind. It proved to be a defining chapter in my career.

Valuable Experience – Valuable Benefits
It is so valuable to have first-hand experience, especially in an industry where there are labor and skill shortages. In addition to shortages, there are often disconnects between field and office.
A couple of years ago, I put out a very informal poll on Twitter. I asked how many times someone as an AEC professional has visited a job site or visited a shop floor. About 20% of the sixty-four votes on that poll stated that they had fewer than ten visits or first-hand experiences. Out of that segmented group, over half stated they had fewer than five visits or first-hand experiences. Note that the informality of the poll did not cover additional details such as career stage, additional breakdowns beyond ten visits, and the trade involved. My purpose for that poll was hoping that the percentage of people visiting job sites or shop floors does not go down over time. This is especially the hope, given that we have experienced a lot more virtual and flexible situations in the industry over the last couple of years.
BIM is a technology that can accelerate productivity in the construction industry. If we are to truly realize the full potential, we can focus on BIM content as an incredibly effective driver. To do this, we need to focus on what matters. Focusing on what matters includes integrating real-life constructability and compatibility scenarios. This is especially the case for helping AEC professionals who may experience challenges with resources, training, productivity, and more. Without the right focus, you end up with digital paperweights that unfortunately do not serve the need. On the other side of the coin, trying to make something look perfect in software might not translate to a real-life benefit.
BIM Content – More than a Download
BIM content (especially for manufacturers) has the potential to be so much more than a download. If we don’t focus on the right things, however, we risk losing the forest for the trees. At a base level, a downloaded file is simply another file in someone’s Downloads folder. It says nothing definitive about what someone did with that download or if it worked for their workflow. Therefore, a downloaded file is not a guarantee that a building product manufacturer product was specified in a project.
In addition, a downloaded file could make or break the user experience. For manufacturers interested in making efforts in a BIM content strategy, there is a cost not only in inaction. There is also a cost in acting without both a macro and micro focus on the right things. Taking it further, there is a cost without sustained action. So, to consider BIM content more than a download, we need to change our thinking about it.
We propose to define the whole concept of manufacturer BIM content a bit differently. We think of BIM content as a digital asset that represents an actual product in more ways than just appearance.
Manufacturer BIM content is a digital asset that represents the product in terms of critical dimensions, clearance, performance, adherence to product standards, availability, applicable features, and system applications. Manufacturer BIM content needs to do this while functioning to the best of its ability in the current releases of the intended software and with respect to the product lifecycle.
That is quite a lot of pressure on a downloaded file. How do we address this?
The Approach Matters
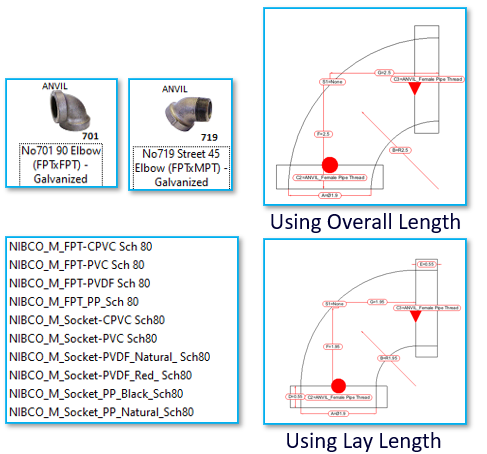
If we are not careful, one-size-fits-all approaches and quick fixes are about as fruitful as the claw games at arcades. I am talking about the ones where you put about $5.00 of quarters in only to leave with a low-quality stuffed animal. Or worse, you end up with nothing for the effort. Additionally, in a real-life piping system, a common phrase I learned from working for a manufacturer is that the system is really only as strong as the weakest point. Connections on fittings are often the weakest point (LeVesque, 2017). In the same way, BIM components, especially those meant to connect to pipe and other elements, are potentially the weakest point in your project.
Therefore, quality BIM content for manufacturers needs a more thorough and multi-faceted approach to bridge the gap between real-life product scenarios and digital design for better outcomes.
[bctt tweet=”BIM components, especially those meant to connect to pipe and other elements, are potentially the weakest point in your project. Therefore, quality BIM content for manufacturers needs a more thorough and multi-faceted approach.”]
The tricky part is defining quality in a way that is not a blanket statement. Several areas may have potential to have “weak points” or deficiencies with respect to many factors.
Different AEC professionals place different levels of importance on various things:
- Some professionals may be interested in geometry for a general placeholder only. They do not (or cannot) place a lot of importance on finalized data quite yet.
- Others may place high importance on functionality. This comes into play with sizing, product selection & specification, performance characteristics, engineering system integration, and flexible parametric design features.
- Still others may place high importance on data. This comes into play with product availability, quantity takeoffs, and accurate dimensions where it counts.
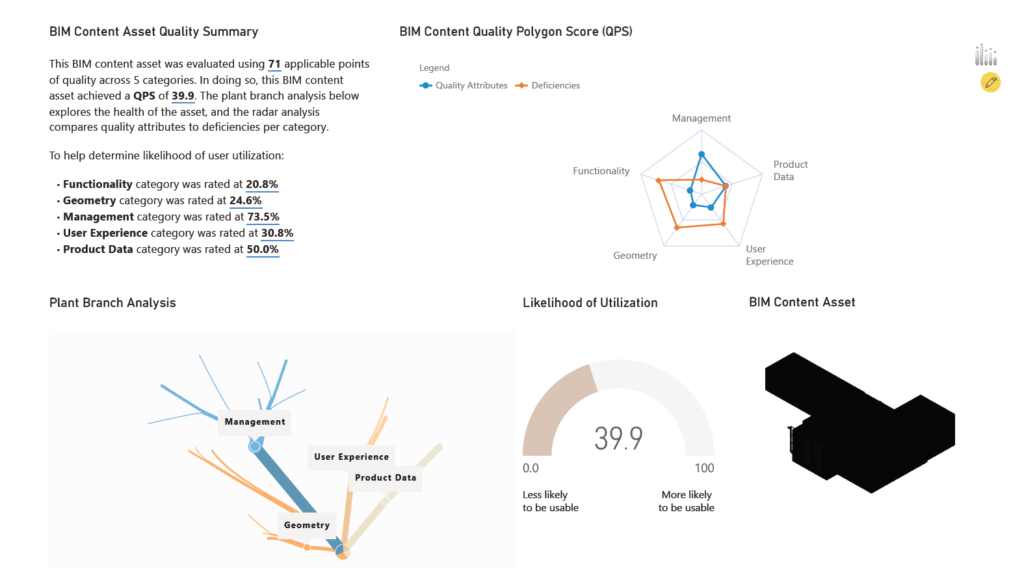
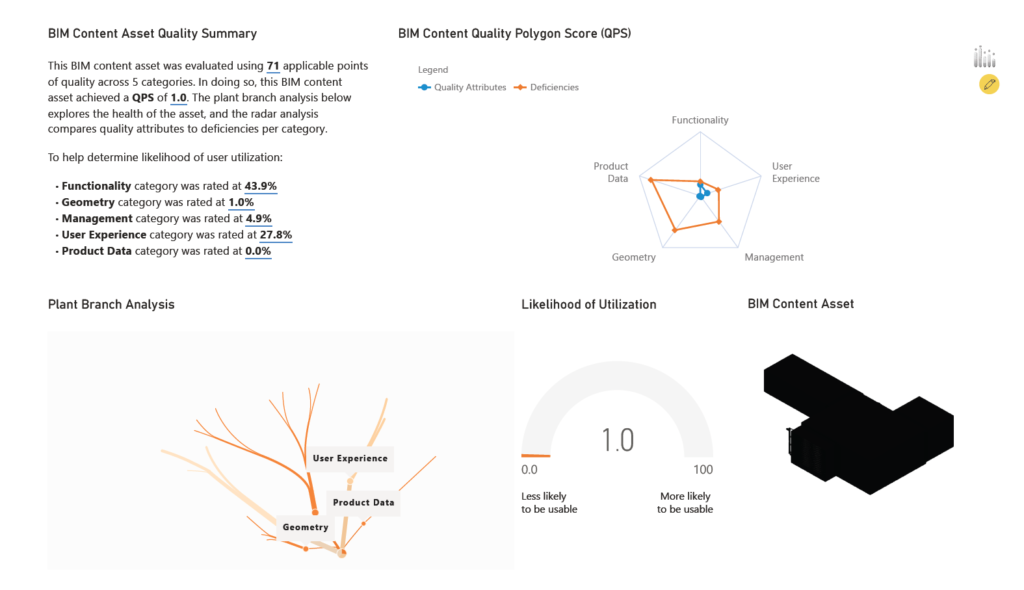
Introducing the Quality Polygon Score
Defining high quality BIM content risks being too subjective if we do not consider a bigger context as well. To visualize something with a more comprehensive lens, we have created the BIM Content Quality Polygon Score, or QPS for short. The QPS is derived from a series of “Yes”/”No” questions. The questions span in a variety of categories pertaining to Geometry, Functionality, Management, User Experience, and Product Data. In addition, there are sixteen sub-categories. Much like the detailed assessments you can get for your car, the QPS is a seventy-five point assessment we use for evaluating BIM content assets and their likelihood of user utilization.
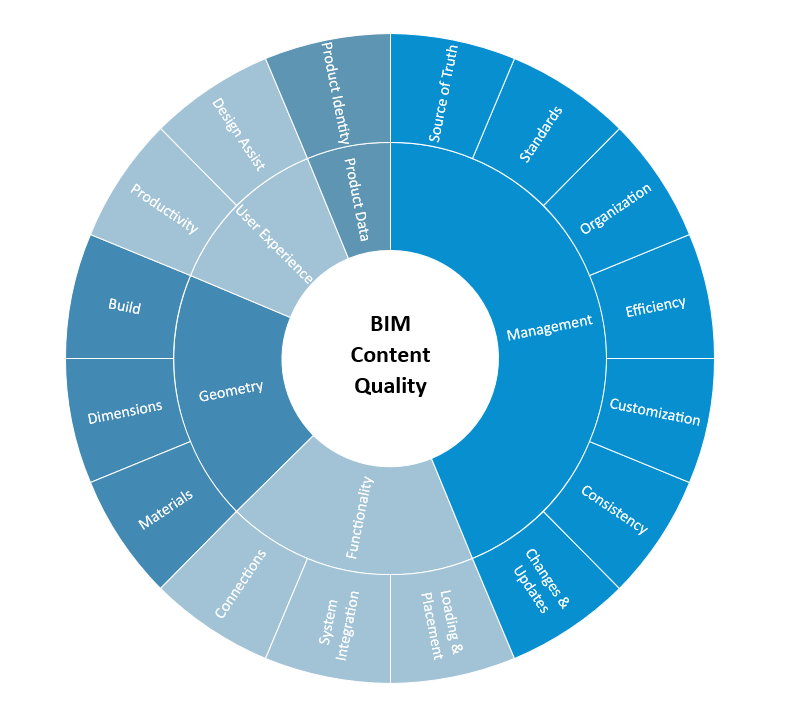
Questions within these categories range from “Can you identify the component as a product in multiple ways?” to “Does this component connect with other components at the right places?” and more. “Yes” or “No” responses on each question are weighted for particular contexts. The context includes considerations such as what building product manufacturer product a BIM content asset represents. In addition, the QPS considers nuances with software such as Autodesk® Revit®, Fabrication CADmep™, etc. Learn more on how we address quality in manufacturer certified Fabrication CADmep™ components specifically in another one of our blog posts.
Flexible design features and built-in design assistance “bumpers” may be important to one professional. That said, the lack thereof might not necessarily hinder the workflow of another professional in a different role with different objectives.
The scores in each category then plot onto a radar analysis chart. From there, we can quickly see where the quality attributes and deficiencies exist in a particular BIM content asset. We then assign a final score from 0 to 100. The zero end of the spectrum would indicate that the BIM content asset is not very usable. Conversely, a score of 100 would indicate that the BIM content asset is likely incredibly usable.
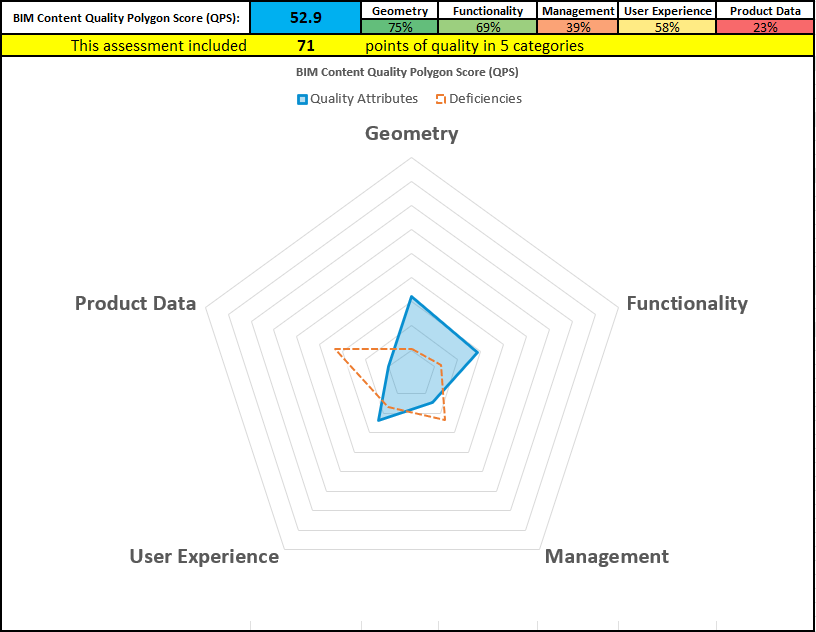
A BIM content asset with a higher QPS score will have a larger blue polygon shape and a smaller (ideally non-existent) orange polygon shape. The sizes of those polygon shapes in relation to each other consider all weighted scores. Nothing is adding or detracting more than necessary in a particular context. Additionally, non-applicable items will not skew the QPS score either way. This is critical to note as various trades may place importance on different aspects. Most importantly, the QPS evaluates BIM content assets where it matters most in a particular context.
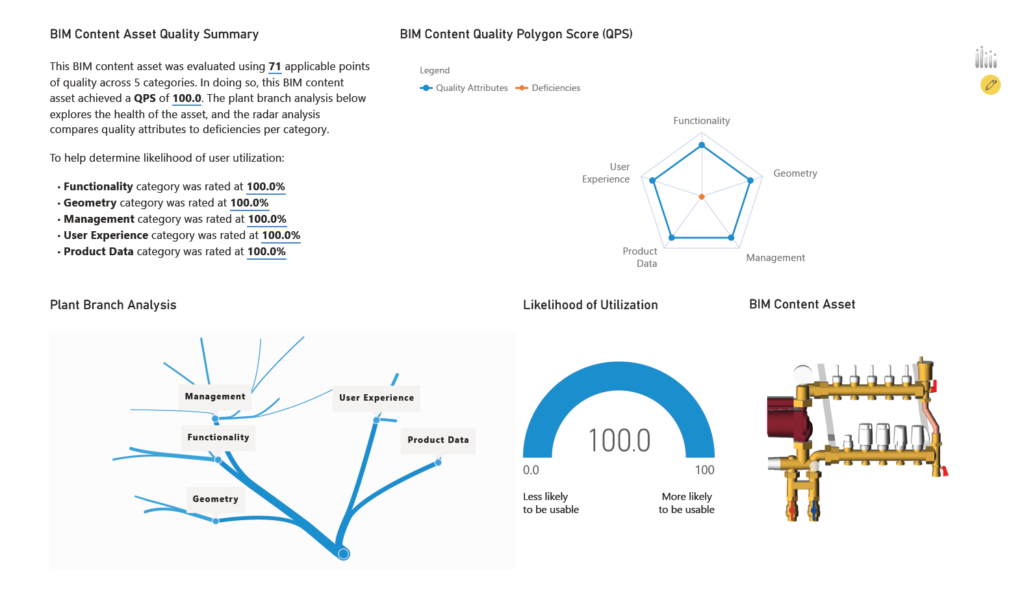
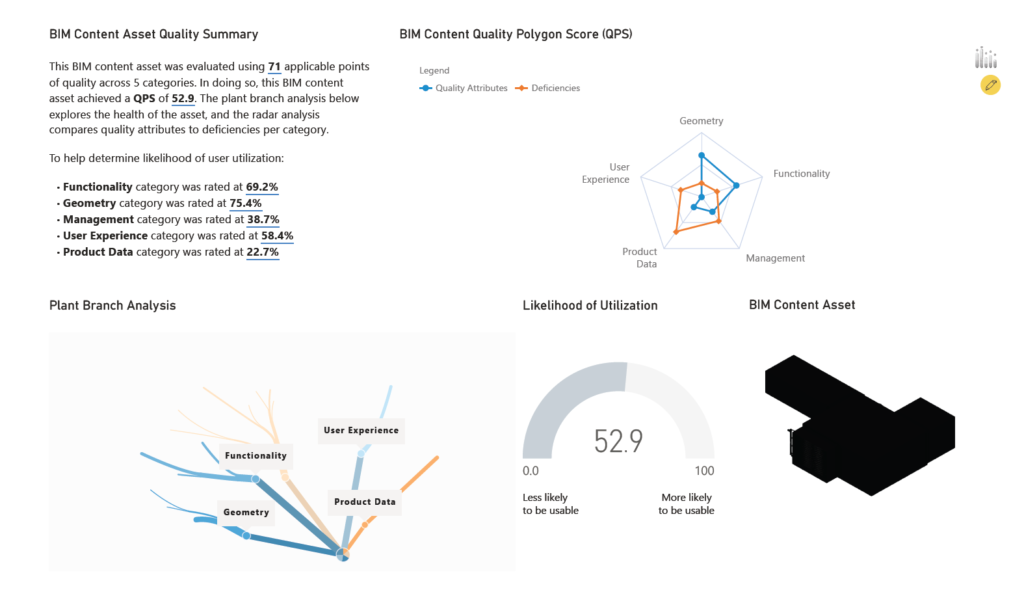
Introducing the Plant Branch Analysis
In addition to the QPS, we also assess BIM content quality with what we call a Plant Branch Analysis chart. We talk a lot about monitoring model health in an entire project. BIM content asset health is also an important concept to bring to light. Much like an actual plant, the Plant Branch Analysis chart for BIM content assets grows and wilts depending on the circumstances. Wilting occurs due to out-of-date data, untapped functionality, inaccessibility, and more. If you have ever forgotten to water a plant or two, you’ll see where I’m going with this 😉.
Manufacturer BIM content asset health is important not just once but over time. Building something perfectly just once is just a snapshot like a photo in a photo album. Without BIM maintenance, you’ll experience a Picture Perfect problem where the BIM content simply doesn’t match up to the current product or technological offering today even though yesterday it was fine.

BIM Content QPS and Plant Branch Analysis
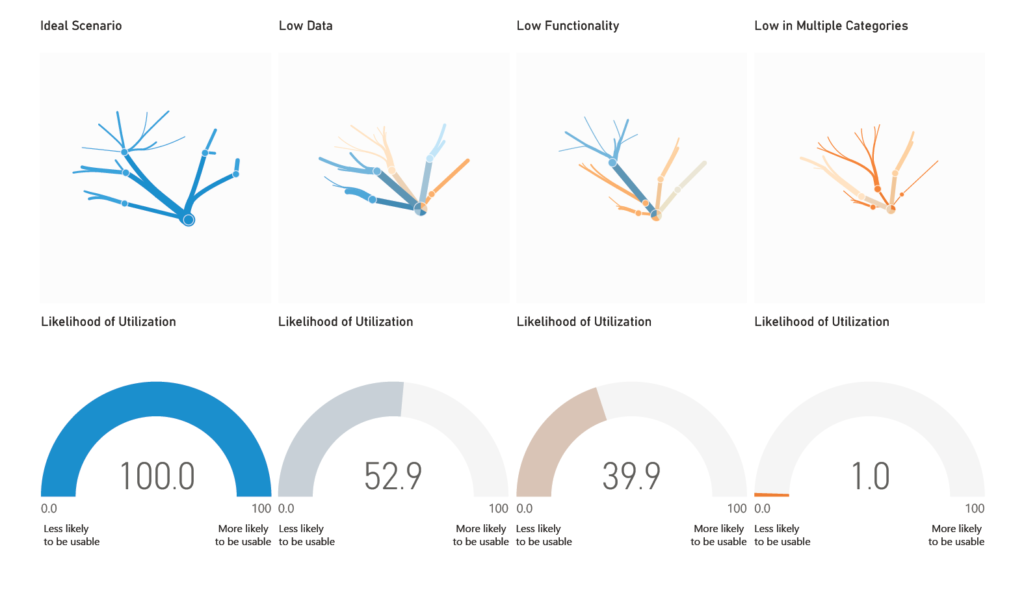
Here are some examples of the QPS and the Plant Branch Analysis at play. We evaluated each example BIM content asset with a series of “Yes”/”No” questions across five categories and sixteen sub-categories. Not all of the seventy-five points applied in every scenario. Because of this, the evaluation and data visualizations reflect the scores out of only the applicable points. These summaries provide a visual of how usable a particular BIM content asset is likely to be for the user.
BIM Content Quality Impacts on Consistency
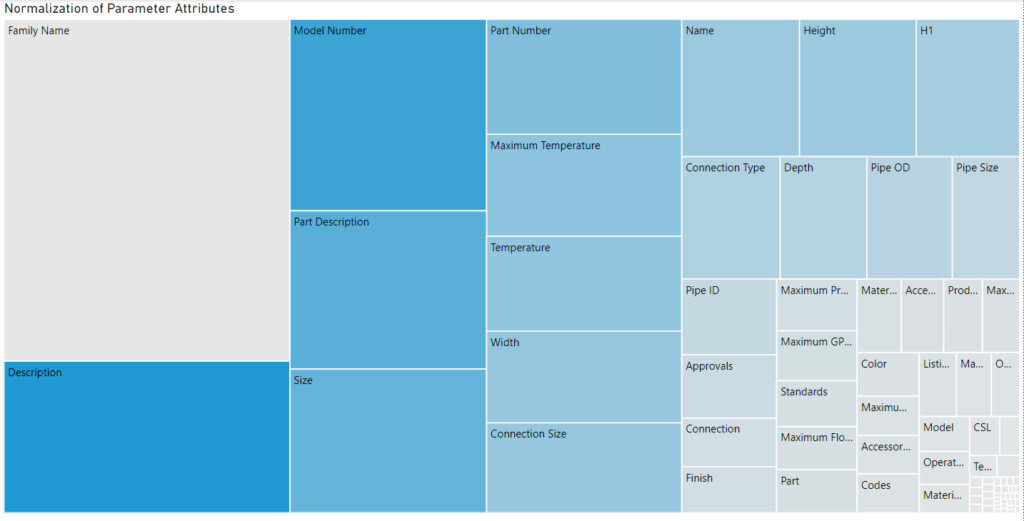
We also use data visualization to further drill down particular avenues to address BIM content quality. In a macro view, inconsistency can affect quality overall because of the time involved in standardization efforts. Rather than use a pie chart where it is harder for the eye to compare areas, we visualize consistency with a tree map (Ricks, 2022). The arrangement of rectangles relative to the number of times that particular parameter name exists across a whole BIM content asset library provides useful insights.
A tree map with a divergent color scheme reveals the following:
- Attributes that exist the most and indicate elevated levels of standardization, as represented by the larger rectangles
- Attributes that indicate one-offs, specific contexts, and parameters that likely are not applicable everywhere anyway. Smaller rectangles indicate these scenarios.
- Attributes that exist as a few different variants across an entire library and could benefit from standardization efforts. The blue indication is the “sweet spot.”
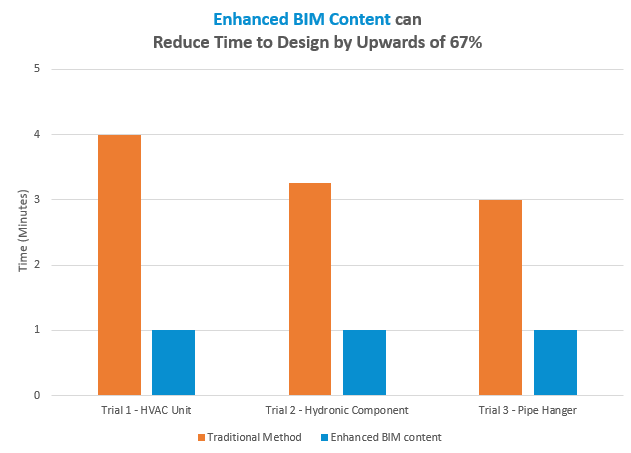
BIM Content Quality Impacts on Productivity
In addition, we can visualize BIM content quality by analyzing time and productivity while using the BIM content assets.
We measured the time it took to look up manufacturer product data to supplement a typical BIM content asset in multiple trials. We compared those times with the times it took to simply use a manufacturer certified BIM content asset. Manufacturer certified BIM content assets have accurately maintained product data and enhanced performance functionality built in already.
This data visualization is supported by three empirical trials. The trials featured Revit specifically and evaluated how long it took to get up and running from download to design. Factors that influenced the time in the “Traditional Method” included the following:
- Navigating broken links on a manufacturer website
- Finding and downloading multiple PDFs to identify selection and performance criteria
- Reading about potential compatible options to fit the system application need
Here are some timed items we did not capture in our trials:
- Addressing potential functionality issues with the found BIM content (if applicable) and data management related activities
- Comparing multiple potential sources of BIM content
- Time that considers how familiar or unfamiliar someone may be with the website resources
- Contextual considerations. For the pipe hangers specifically, the tracked time only included finding one clevis hanger and reading about different options. The time did not include time looking at other options, seeing what other components were compatible, and finding BIM content for the configuration desired.
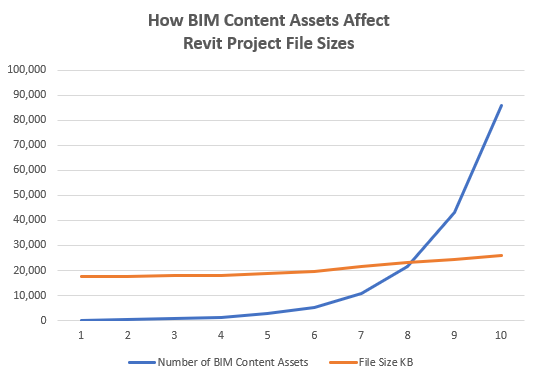
BIM Content Quality Impacts on File Sizes
Additionally, file sizes are certainly a concern when it comes to BIM content quality. We use data visualization in this area to assess how a BIM content asset affects file size. A Revit project file is ultimately affected once by a uniquely loaded and placed BIM content asset. We can conduct a useful test by duplicating that same BIM content asset in a Revit project. Observing the effects on the Revit project size over multiple trials provides helpful insights. Note that it is not a direct accumulative result.
We can load and place well over twenty thousand BIM content assets in a Revit project file. The Revit project file size itself will hover around 17-25 MB. That tells us that if we are mindful of Revit family file sizes while building enhanced BIM content assets, Revit project file sizes will experience minimal impact.
Conclusion
In conclusion, we believe quality BIM content is so much more than a download. While BIM technology is exciting, we need to make sure it ties to successful outcomes in real-life construction as well. The industry that we work in highlights that productivity is the key to success. We need to focus on the right things and in the right context for that to happen.
For manufacturers, BIM content at its base may not be a golden ticket for product specification and beyond. However, a solid multi-faceted strategy is critical to not only have products specified, but actually purchased and used again and again.
For other AEC professionals, a one-size-fits-all approach and quick fixes will often not fit the need. Maximizing your productivity and reducing your downtime are paramount.
Next Steps
Our team of specialists is here to help you be successful, regardless of your role in the industry. We offer BIM content Quality assessment summaries of existing BIM content. What you have seen and read about in this blog post is part of our BIMspector services. BIMspector is the first true multi-faceted quality assurance assessment for BIM content, and is offered in two flavors: BIMspector Premium and BIMspector Lite. Please contact us to learn more about what the power of BIMspector can do for you.

After learning valuable insights from our BIMspector services, you need a plan to turn insights into action. We offer BIM content creation and management services with a comprehensive multi-faceted approach for a variety of needs.
Manufacturer clients who are new to our collaborative and flexible process will be guided every step of the way with our comprehensive process. We back our process with first-hand experience and understanding of your goals. You and your customers’ successes are also our success. Experience the difference.
We are AEC professionals who build for AEC professionals, and we look forward to an opportunity to work with you. Please contact us at info@ENGworksGlobal.com to learn more.
Sources Cited:
LeVesque, M. (2017, August 30). Pipes are only as strong as the weakest point – generally, the connections. San Gabriel Valley Tribune. Retrieved May 9, 2022, from https://www.sgvtribune.com/2016/09/29/pipes-are-only-as-strong-as-the-weakest-point-generally-the-connections/#:~:text=The%20weak%20point%20is%20usually%20the%20connections.
Ricks, E. (2022, February 10). What is a pie chart and when to use it. storytelling with data. Retrieved May 9, 2022, from https://www.storytellingwithdata.com/blog/2020/5/14/what-is-a-pie-chart
Autodesk Trademark Notice:
Autodesk, the Autodesk logo, Revit, and Fabrication CADmep are registered trademarks or trademarks of Autodesk, Inc., and/or its subsidiaries and/or affiliates in the USA and/or other countries.
This publication is independent of Autodesk, Inc., and is not authorized by, endorsed by, sponsored by, affiliated with, or otherwise approved by Autodesk, Inc.
The ENGworks Global Team
Please also connect with us on our social media platforms below to stay up to date with our announcements.